2021 Year in Review (with a bit of 2020 and 2022 thrown in)
With 2021 already in the rearview mirror, 2022 is full steam ahead! At the close of the year, the documentation team officially celebrated its first full calendar year using Google Analytics to gauge user interaction on the Knowledge Base. You might not have known that we track the site, so here are some insightful stats wrapped up in a 2021 review and where the site’s currently sitting.
In mid-August 2020, we installed Google Analytics. Since that first full month in September 2020, we experienced a 90% increase in monthly users by the same time the following year (September 2021). We saw massive growth in 2021 when Banno teams began intentionally promoting the Knowledge Base in customer communication—primarily the Banno Statement and the newly redesigned Banno Enterprise—and the site “exploded” with users visiting the site. Because these customers now use the site, our analytics currently stay fairly consistent. We don’t expect extreme growth in the future, but we continue seeing increases in the number of users utilizing the Knowledge Base. Also, depending on the frequency of our digital communication with customers and the content’s level of importance, this can also drive up site traffic.
What to Expect in 2022
We anticipate a steady increase in site usage because of dedicated documentation sections within the Banno Statement. We’ll also post quarterly updates letting you know what we see, and we welcome feedback or additional info you might want in future reports. Here’s to the year ahead and seeing how customers continue to engage with the Knowledge Base!
Overall Audience/User Overview
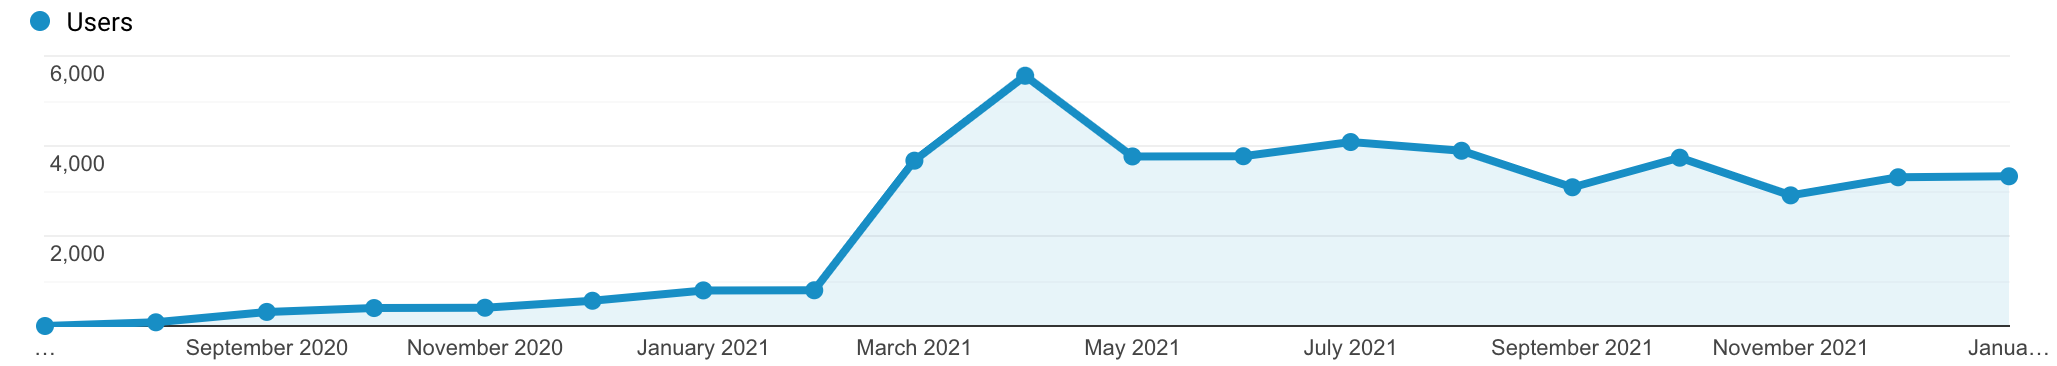 Number of monthly users from Aug. 2020 to today
How much we’ve grown since our humble beginning:
- Starting in August 2020: 82 users
- First full month (September 2020): 313 users
- One year later (September 2021): 3,083 users
- 90% increase from September 2020
- This month to date (Jan. 26): 3,327 users
How many users have visited the site?
Since August 2020, we’ve had 31,814 users visit the site.
How are users engaging with the site?
Based on the analytics, we see users getting in there quick and finding what they need:
- Sessions: 68,123 (number of times users actively engaged on the site)
- Pageviews: 207,311
- Number of sessions per user: 2.14
- Pages per session: 3.06
- Avg. session duration: 00:02:16
See Top 3 Visited Pages for the most popular pages.
2021 Audience/User Overview
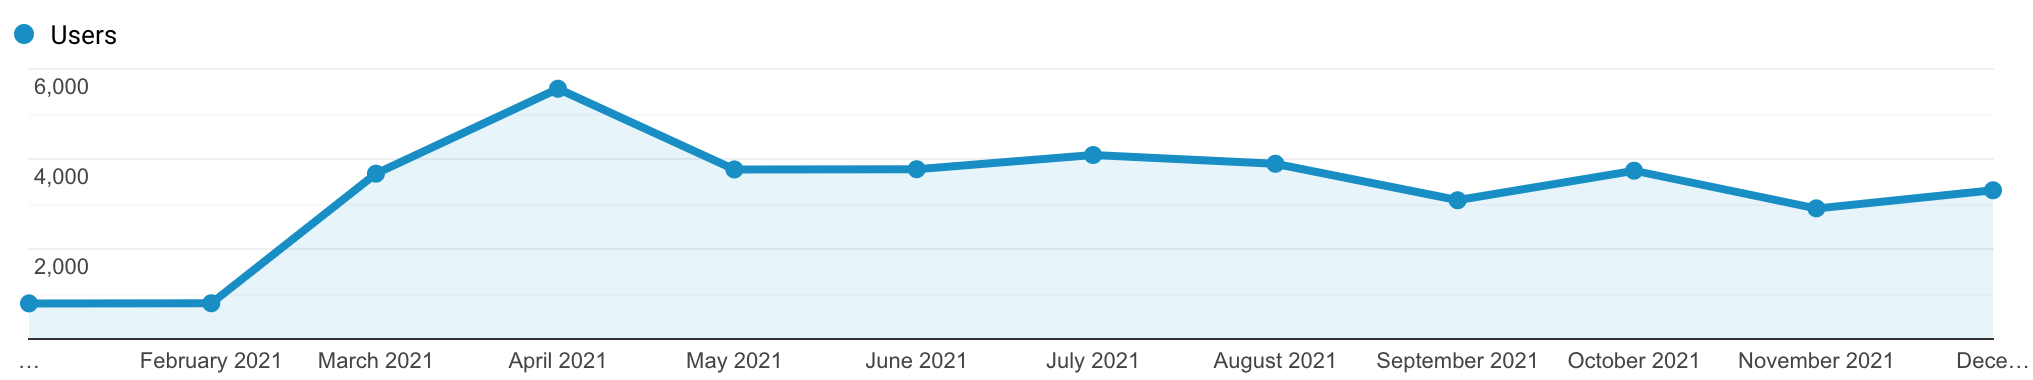 Number of monthly users throughout 2021
Since the redesigned enterprise site went live on April 6, it’s likely we have a significant increase in site usage because an institution’s dashboard now includes links directly to the Knowledge Base.
- Total of 30,461 users and 30,493 new users
- Average 3,281 users per month
- From the start of the year to the end:
- January number of users: 791
- December number of users: 3,305
- Most visited month: 5,561 users in April
- Since the start of the year, the site peaked at an 85.8% increase in users.
- Most visited week:
- 2,982 users between April 4-10
- Most visited days:
- 1,042 users on Wednesday, April 7
- The redesigned enterprise site went live April 6.
- 1,015 users on Thursday, March 4
- Customer communication was emailed with a link to the Enterprise transition guide.
- It’s a pretty big deal when 1,000+ users visit the site in a single a day.
- 1,042 users on Wednesday, April 7
- 7 different days with 500+ users
28 Day Active Users
- Average 28 day active users - 2,904
- From the start of the calendar year to the end, we saw an 83% increase in 28 day active users:
- Jan 1, 2021: 28 day active users - 491
- Dec 31, 2021: 28 day active users - 2,904
- The current number of users in a 28 day period: 3,405
- Highest 28 day active users: April 26 - 5,728
- Lowest 28 day active users: January 18 - 427
- Given the holidays during that time, a low number is expected.
Top Three Visited Pages
- After the homepage, the top three most popular pages include:
- /people/ - 12,857 page views
- /people/authentication/ - 11,351 page views
- /support/inbox/ - 8,418 page views
- This data helps us discover customer pain points, reorganize content, know which sections could use more robust documentation, etc.
- Desktop is the preferred choice of access - used 96% of the time.
Let the doc team know if you have feedback, questions, or want additional info in future updates!