By the time we share this third quarter report, you may have noticed a different “look” for the Knowledge Base! In keeping up with the Jack Henry rebrand, we updated the site’s aesthetics for a fresher and more modern feel. We hope you like it as much as we do! More exciting changes will be on the way with redesigning the site architecture and homepage. Stay tuned!
Going forward with our reports, we’re beginning to focus on how users access the Knowledge Base, understand user behavior, and share more of the top visited pages. This will help us hone in on building out specific topics. We’re also sharing more details on how the Knowledge Base grows from year-to-year and quarter-to-quarter. It’s rewarding to see how much user activity has increased since we first started using Google Analytics!
Let the doc team know if you have feedback, questions, or want additional info in future updates.
Audience/User Overview
Total Traffic
In figure 1, traffic to the site is up slightly from last quarter and continues to increase quarter-over-quarter.
Figure 1 | Number of users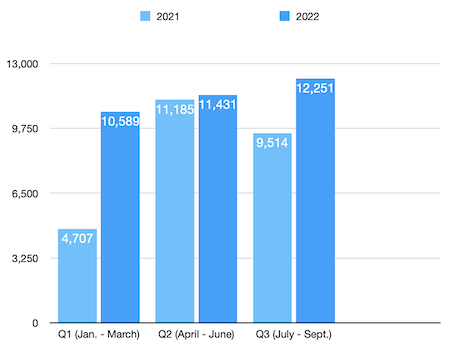
Here’s an overall comparison as the number of users and their engagement continues to increase:
| '22 third quarter | Compared to last quarter | Compared to '21 third quarter | |
| Users | 12,251 | +7.1% | +28.7% |
| New users | 9,773 | +6.8% | +33.8% |
| Sessions | 22,729 | +6.6% | +35.2% |
| Pageviews | 63,590 | +7.1% | +28.7% |
| Pages/session | 2.80 | +7.1% | +28.7% |
| Average users/month | 4,706 | +6.1% | +27.6% |
| Most visited day | 885 users | -.02% | +35.9% |
Additional analytics to be aware of include the following:
- Average session duration: 2 minutes 15 seconds
- Most visited weeks:
- 1,540 users between July 3-9
- 1,411 users between Sept. 11 - 17
- Compared to last (second) quarter, the most visited week was -16% lower, but traffic was primarily consistent week-to-week. Last quarter, there was a service interruption on April 5 that led to a higher than normal visited day.
- Most visited days:
- There were 373 users on Tuesday, Aug. 30 is likely due to the emailed August Banno Statement. The Banno Statement was emailed late afternoon on Monday, Aug. 29. The number of users is slightly higher than average, so it’s fairly consistent with daily traffic.
- There were 361 users on Monday, Aug. 15
- Note: There were 885 “users” on Thursday, July 7, but the actual number of users is 322 because 563 users were bots.
Visitor Acquisition Types
The vast majority of visitors accessed the site through direct traffic. The following chart details the traffic sources for the site during the third quarter:
Figure 2 | Number of users by acquisition type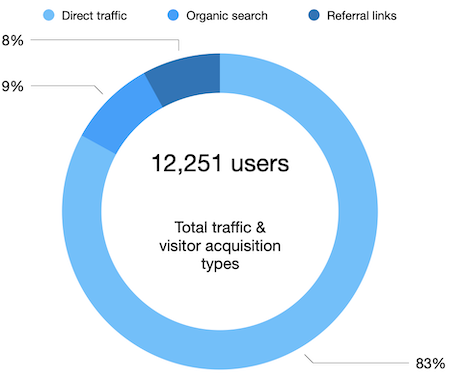
Descriptions for each acquisition type shown in Figure 2 include:
- 12,251 users
- Direct traffic: 10,228 users typed the website address into the URI bar or clicked on a link to the Knowledge Base.
- Organic search: 1,058 users accessed the website via our links in search results.
- Referral links: 1,015 users accessed the website via another source (often non-Google ads).
- Social (Facebook): 1 user accessed the website via a link on social media.
Device Type
Figure 3 shows that the majority of users accessed the site via desktop:
Figure 3 | Device used to access the site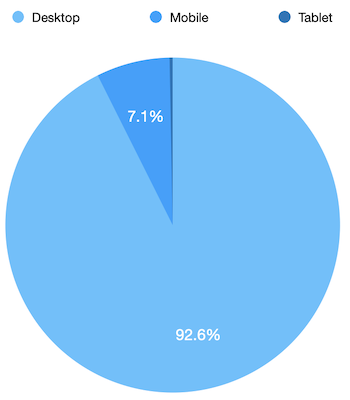
The breakdown of the 12,234 users using a specific device includes:
- 11,325 users via desktop
- 867 users via mobile
- 42 users by tablet (.3%)
- Note: The number of users tracked is slightly less than the 12,251 users that Google analytics reported.
7 Day Active Users
The number of users who visited the Knowledge Base at least once within a seven day timeframe during the third quarter includes:
- Average 7 day active users: 1,161
- Highest 7 day active users: Wednesday, July 13 - 1,731
- Note: The actual highest 7 day active users should be 1,168 users (1,731 minus the 563 bot “users” that visited the Knowledge Base on July 7.
- Lowest 7 day active users: Tuesday, Sept. 6 - 1,025
Site Load Time
The site load time, as well as the best and worst performing browsers, includes:
- Average load time: .65 seconds
- Best-performing browser: Chrome .61 seconds
- Worst-performing browser: Safari 1.33 seconds
Top 15 Visited Pages
After the homepage, the top 15 most popular pages include:
- /apps/accounts/ - 5,921 pageviews
- /people/ - 4,100 pageviews
- /apps/ - 2,597 pageviews
- /support/inbox/ - 2,544 pageviews
- /people/authentication/ - 2,278 pageviews
- /support/ - 2,170 pageviews
- /apps/authentication/ - 2,169 pageviews
- /settings/users/ - 1,577 pageviews
- /cms/ - 1,557 pageviews
- /people/settings/ - 1,556 pageviews
- /reports/ - 1,284 pageviews
- /settings/ - 1,219 pageviews
- /marketing/ - 864 pageviews
- /cms/training-videos/ - 860 pageviews
- /support/settings/ - 807 pageviews
How many users have visited the site?
Since using Google Analytics starting in August 2020, we’ve had 57,283 new users visit the Knowledge Base.