We ended the year with a bang—traffic is up from last quarter and we saw the most number of visitors in a single quarter. Read on for more, and check out 2022 in review!
Let the doc team know if you have feedback, questions, or want additional info in future updates.
Audience/User Overview
Total Traffic
In figure 1, traffic to the site is up slightly (once again!) from last quarter and continues to increase (still!) quarter-over-quarter.
Figure 1 | Number of users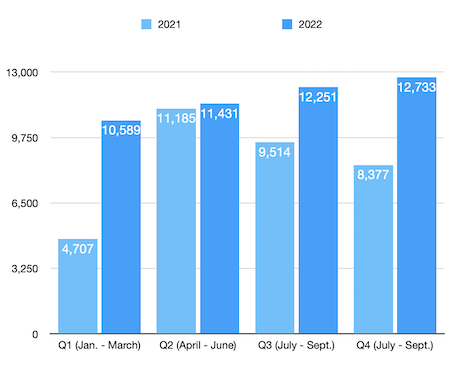
Here’s an overall comparison as the number of users and their engagement continues to increase:
| '22 fourth quarter | Compared to '22 third quarter (last quarter) | Compared to '21 fourth quarter | |
| Users | 12,733 | +3.9% | +51.9% |
| New users | 10,511 | +7.6% | +59.4% |
| Sessions | 21,649 | -4.7% | +35.9% |
| Pageviews | 58,939 | -7.3% | +22.3% |
| Pages per session | 2.72 | -2.8% | -9.9% |
| Average users per month | 4,785 | +1.6% | +44.3% |
| Most visited day | 552 users | -37.6% | -9.8% |
Additional analytics to be aware of include the following:
- Average session duration: 2 minutes 6 seconds
- Most visited weeks:
- 1,576 users between October 30 - November 5
- 1,363 users between November 13 - November 19
- Compared to last (third) quarter, the most visited week was +2.3% higher. It’s likely that institutions noticed that app version updates hit the store and they likely checked the release notes that included links to the Knowledge Base.
- Most visited day: There were 552 users on Thursday, November 3. November 3 also fell during one of the most visited weeks in the fourth quarter. It’s likely that institutions noticed that app version updates hit the store and they likely checked the release notes that included links to the Knowledge Base.
Visitor Acquisition Types
The vast majority of visitors accessed the site through direct traffic. The following chart details the traffic sources for the site during the fourth quarter:
Figure 2 | Number of users by acquisition type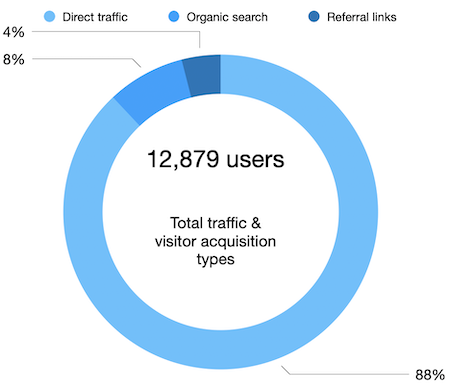
Descriptions for each acquisition type shown in Figure 2 include:
- 12,879 users
- Direct traffic: 11,363 users typed the website address into the URI bar or clicked on a link to the Knowledge Base.
- Organic search: 1,043 users accessed the website via our links in search results.
- Referral links: 472 users accessed the website via another source (often non-Google ads).
- Social (Facebook): 1 user accessed the website via a link on social media.
Observations
- The number of users displayed (12,879 users) is more than the 12,733 users that Google analytics reports. This is likely because Google Analytics has different methods for counting and delivering data.
- The majority of user continues to visit the Knowledge Base via direct traffic and is +5% higher than last quarter.
Device Type
Figure 3 shows that the majority of users accessed the site via desktop:
Figure 3 | Device used to access the site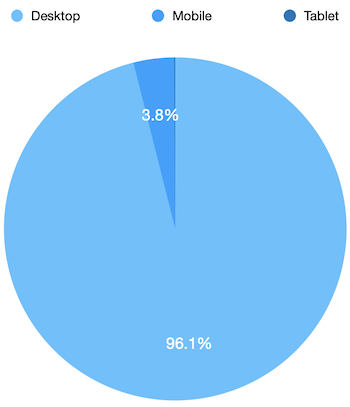
The breakdown of the 12,777 users using a specific device includes:
- 12,272 users via desktop
- 492 users via mobile
- 13 users by tablet (.3%)
Observations
- The number of users displayed (12,777 users) is more than the 12,733 users that Google analytics reports. This is likely because Google Analytics has different methods for counting and delivering data.
- The majority of user continues to visit the Knowledge Base via desktop and is +3.5% higher than last quarter.
7 Day Active Users
The number of users who visited the Knowledge Base at least once within a seven day timeframe during the third quarter includes:
- Average 7 day active users: 1,130
- Highest 7 day active users: Thursday, November 3 - 1,639
- Lowest 7 day active users: Monday, December 26 - 947
- This number is likely due to the holidays.
Site Load Time
The site load time, as well as the best and worst performing browsers, includes:
- Average load time: .81 seconds
- Best-performing browser (and second most popular): Edge .63 seconds (3,077 users)
- Most popular browser: Chrome .86 seconds (9,032 users)
- Worst-performing browser: YaBrowser 2.93 seconds and Safari 1.44 seconds
Top 10 Landing Pages
Depending how a user lands on the Knowledge Base, we want to understand the top landing pages as well as subsequent actions they took on the site. As we look at the user journey and behavior flows, we recognize that the homepage is by far the top landing page and people continually return to it throughout their user experience.
The homepage is the most popular landing page on the Knowledge Base with 4K sessions and 8,940 pageviews. From the homepage, the top four first interactions that users made include visiting these pages:
After the homepage, the top 10 most popular pages include the following list (based on sessions). As we look further into behavior flows, the top four pages include the top two “first interaction” a user took from the landing page.
- /apps/accounts/ 2.9K sessions
- /people/ 1.5K sessions
- /support/inbox/ 1K sessions
- /support/ 856 sessions
- /apps/ 711 sessions
- /people/authentication/ 633 sessions
- /cms/ 585 sessions
- /settings/users/ 552 sessions
- /reports/ 497 sessions
- Our homepage does well driving traffic in to the Knowledge Base, and it appears people use the home page to drive themselves back in to the site.
Top 15 Visited Pages
The homepage is the most visited starting page on the Knowledge Base. From the homepage, the top five pages users visited include:
- /collateral/ 157 pageviews
- /monitor/ 155 pageviews
- /enterprise/ 38 pageviews
- /enterprise/session-timeout/ 5 pageviews
- /history/ 4 pageviews
After the homepage, the top 15 most popular pages include the following:
- /apps/accounts/ 5,092 pageviews
- /people/ 3,439 pageviews
- /apps/ 2,417 pageviews
- /apps/authentication/ 2,009 pageviews
- /people/authentication/ 1,918 pageviews
- /support/ 1,900 pageviews
- /support/inbox/ 1,810 pageviews
- /settings/users/ 1,381 pageviews
- /cms/ 1,350 pageviews
- /people/settings/ 1,308 pageviews
- /reports/ 1,252 pageviews
- /people/users/ 1,242 pageviews
- /settings/ 1,145 pageviews
- /support/settings/ 776 pageviews
- /cms/training-videos/ 758 pageviews
How many users have visited the site?
Since using Google Analytics starting in August 2020 through the end of 2022, we’ve had 67,794 new users visit the Knowledge Base and 444,880 pageviews.