2022 was a second straight year of significant growth. Compared to 2021, we saw nearly a 40% rise in users! Starting in February 2022, we had 4,000+ users visit the Knowledge Base each month—January 2022 was close with 3,896 users. We attribute this growth not only to the increasing number of customers, but the Knowledge Base’s expanded visibility with customers.
Starting January 2022, the monthly Banno Statement now includes a specific documentation section highlighting and linking to timely features, new docs, and updated content on the Knowledge Base. If relevant, the monthly release notes also link to documentation on the Knowledge Base. Additionally, we updated the site for a fresher and more modern feel based on Jack Henry’s rebrand. Surely a better “look” helps our effort.
Product collateral now lives on the Knowledge Base, and the sales team regularly shares these docs with current and prospective customers. This growing list of documentation is now up to 39 docs.
In 2022, the documentation team looked at tracking SLA email analytics, but the platform that Banno platform uses to send emails doesn’t track analytics such as open rates, click through rates, etc. Having a platform that tracks email analytics would be beneficial to our efforts, but this is a change outside of our control.
What’s ahead for 2023?
As we make our way through 2023, we continue linking to documentation in our customer communications, and our efforts also include:
- Publishing customer-facing documentation and ops docs prior to feature releases and updates. We understand the importance of being ahead of the curve and how this plays in to proactively addressing questions and alleviating cases.
- New site architecture–we’re excited about this one!
- Integrating documentation for additional Jack Henry digital products.
- Improving the Knowledge Base’s search functionality. We’re aware that this section of the Knowledge Base can use some improvement.
- As other products are added to the digital lineup, we’re building out documentation.
- With the addition of Mixed Panel as a tool that the Product team uses, we’ll be working with the team to see how we can complement that tracking with our Google analytics. Once Mixed Panel begins tracking Banno Admin, we’ll also see how we can leverage the Knowledge Base for Banno Admin documentation.
Let the doc team know if you have feedback, questions, or want additional info in future updates.
Audience/User Overview
Total Traffic
In figure 1, traffic to the Knowledge Base grew nearly 40% from 2021 to 2022.
Figure 1 | Number of users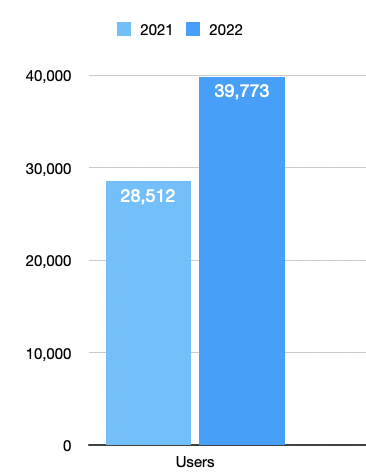
In figure 2, traffic to the site grows year-over-year.
Figure 2 | Number of users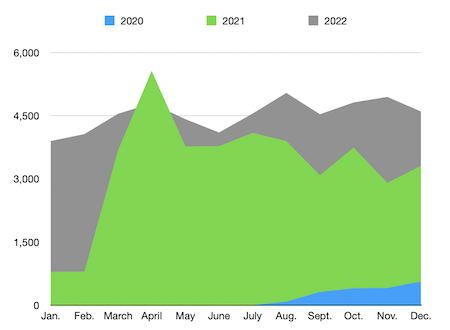
Note: The spike in April 2021 traffic was a result of the new institution dashboard in Banno Admin linking directly to the Knowledge Base.
Here’s an overall comparison of 2021 and 2022 as the number of users and their engagement continues to increase:
| 2021 | 2022 | Growth | |
| Users | 28,512 | 39,773 | +39.5% |
| New users | 28,399 | 37,927 | +33.6% |
| Sessions | 59,925 | 86,651 | +44.6% |
| Number of sessions per user | 2.10 | 2.18 | +3.8% | Pageviews | 183,011 | 252,337 | +37.9% |
| Pages per session | 3.05 | 2.91 | -4.6% |
| Average users per month | 3,281 | 4,523 | +37.9% |
| Most visited day | 1,042 | 887 | -14.9% |
Additional 2022 analytics to be aware of include:
- The Knowledge Base had 4,000+ users almost every single month—January had 3,896 users.
- Average session duration: 2 minutes 19 seconds
- Most visited weeks:
- 1,844 users between April 3 - April 9
- We believe the most visited week was the result of a service interruption on April 4 that impacted both Banno Enterprise and Consumer facing apps. The interruption and restored emails went out in the afternoon, so we believe institutions checked the Knowledge Base in the time leading up to and during the interruption. If our hypothesis is correct, it’s GREAT seeing users self-serve by turning to the Knowledge Base with questions and concerns.
- Compared to 2021 (2,982 users between April 4-10), the most visited week was -38.2% lower. The redesigned enterprise site went live April 6, 2021. It featured the newly added institution dashboard with direct section links to the Knowledge Base. It is to be expected that that large amount of traffic wouldn’t repeat in 2022.
- 1,675 users between May 15 - May 21
- Most visited days:
- There were 887 users on Wednesday, May 18. We’re unsure why there were this many users—there was no customer communication or incidents around this date.
- Compared to 2021 (1,042 users on Wednesday, April 7), the most visited day was -14.9% lower. The redesigned enterprise site went live April 6, 2021. It featured the newly added institution dashboard with direct section links to the Knowledge Base. It is to be expected that that large amount of traffic wouldn’t repeat in 2022.
- There were 885 “users” on Thursday, July 7, but the actual number of users was 322 because 563 users were referral spam users.
- There were 802 users on Tuesday, April 5. We believe the most visited day was the result of a service interruption that impacted both Banno Enterprise and Consumer facing apps. See above for more details.
- There were 887 users on Wednesday, May 18. We’re unsure why there were this many users—there was no customer communication or incidents around this date.
Visitor Acquisition Types
The vast majority of users accessed the site through direct traffic. The following chart details the traffic sources (medium) for 2022.
Figure 2 | Number of users by acquisition type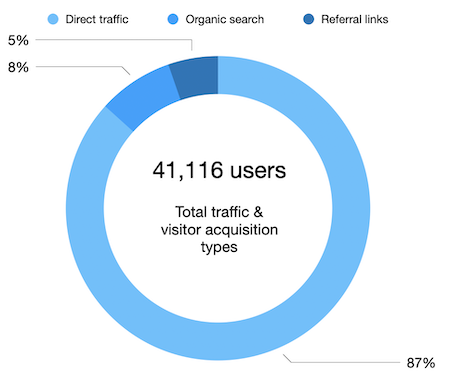
Descriptions for each acquisition type (medium) shown in Figure 2 include:
- Direct traffic: 35,657 users typed the website address into the URI bar or clicked on a link to the Knowledge Base.
- Organic search: 3,274 users accessed the website via our links in search results.
- Referral links: 2,182 users accessed the website via another source (often non-Google ads).
- Social (Facebook): 3 users accessed the website via a link on social media.
Observations
The number of users displayed (41,116 users) is more than the 39,733 users that Google analytics reports. This is likely because Google Analytics has different methods for counting and delivering data.
| 2021 | 2022 | Growth | |
| Direct traffic | 25,699 | 35,657 | +38.7% |
| Organic search | 2,091 | 3,274 | +56.6% |
| Referral links | 1,460 | 2,182 | +49.5% |
| Social | 1 | 3 | +200% |
What’s the breakdown of where our users come from?
Our top 15 sources/mediums for traffic acquisition include:
| Number of users | |
| 1. (direct) / (none) | 35,657 |
| 2. google / organic | 2,647 |
| 3. trafficpro.store / referral | 563 |
| 4. bing / organic | 496 | 5. hfcunet.houstonfcu.net / referral | 263 |
| 6. jackhenry.dev / referral | 246 |
| 7. statics.teams.cdn.office.net / referral | 91 |
| 8. forclients.jackhenry.com / referral | 85 |
| 9. trello.com / referral | 83 |
| 10. basecamp.com / referral | 81 |
| 11. duckduckgo / organic | 59 |
| 12. link.zixcentral.com / referral | 58 |
| 13. link.edgepilot.com / referral | 56 |
| 14. github.com / referral | 45 |
| 15. baidu / organic | 41 |
Observations
- The majority of our traffic (35,657 users) visit the site by typing the website address into the URI bar or clicking on a link directly to the Knowledge Base. As a Documentation team involved with customer communication, we intentionally link to docs on the Knowledge Base from the Banno Statement and release notes. In 2023, we’ll continue to prioritize linking directly to the Knowledge Base from these customer communications.
- For referral sources that reference institutions (ex. hfcunet.houstonfcu.net), it’s likely institution users click links from the institution dashboard in Banno Admin to the Knowledge Base.
- Out of all of our institutions, Houston Federal Credit Union had the highest amount of users visit the Knowledge Base (263 users).
- On Thursday, July 22 and Monday, July 18 the Knowledge Base experienced a number of referral spam users (562 and 23 respectively). Typically, the Knowledge Base doesn’t experience bot traffic or referral spam.
- Users are accessing the site from For Clients. We assume these are links in the release notes.
- While it would be helpful, Google Analytics doesn’t provide insight for distinguishing between internal Banno users from external users.
Device Type
Figure 3 shows that the majority of users accessed the site via desktop:
Figure 3 | Device used to access the site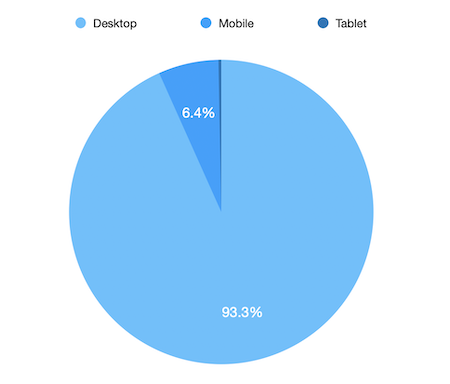
The breakdown of 39,863 users using a specific device includes:
- 37,180 users via desktop (93.3%)
- 2,568 users via mobile (6.4%)
- 115 users by tablet (.3%)
Observations
- The number of users displayed (39,863 users) is slightly more than the 39,773 users that Google analytics reports. This is likely because Google Analytics has different methods for counting and delivering data.
| 2021 | 2022 | Growth | |
| Desktop | 26,742 | 37,180 | +39.0% |
| Mobile | 1,491 | 2,568 | +72.2% |
| Tablet | 207 | 115 | -44.4% |
7 Day Active Users
The number of users who visited the Knowledge Base at least once within a seven day timeframe during the third quarter includes:
- Average 7 day active users: 1,130
- Highest 7 day active users: Thursday, April 7 - 1,936
- Lowest 7 day active users: Monday, May 30 - 827
- This number is likely due to the holiday weekend.
Site Load Time
The site load time, as well as the best and worst performing browsers, includes:
- Average load time: .74 seconds
- Best-performing browser (and second most popular): Edge .71 seconds (10,217 users)
- Most popular browser: Chrome .74 seconds (27,407 users)
- Worst-performing browser: YaBrowser 2.93 seconds and Safari 1.31 seconds
User Behavior
Top 10 Landing Pages
Depending how a user lands on the Knowledge Base, we want to understand the top landing pages as well as subsequent actions they took on the site. As we look at the user journey and behavior flows, we recognize that the home page is by far the top landing page and people continually return to it throughout their user experience.
The homepage is the most popular landing page on the Knowledge Base with 19k sessions. From the homepage, the top four first interactions that users made include visiting these pages:
After the homepage, the top 10 most popular pages include the following list (based on sessions). As we look further into behavior flows, the top four pages include the top two “first interaction” a user took from the landing page.
- /apps/accounts/ 8K sessions
- /people/ 6.6K sessions
- /support/inbox/ 5.6K sessions
- /people/authentication/ 4.6K sessions
- /support/ 3.4K sessions
- /cms/ 3.2K sessions
- /settings/users/ 3.2K sessions
- /reports/ 2.5K sessions
- /people/settings/ 2.3K sessions
- /apps/ 2K sessions
- Our homepage does well driving traffic in to the Knowledge Base and it appears people use the home page to drive themselves back in to the site.
Top 15 Visited Pages
After the homepage (with 46,900 pageviews), the top 15 most popular pages include the following:
- /people/ 16,674 pageviews
- /apps/accounts/ 15,625 pageviews
- /people/authentication/ 11,428 pageviews
- /support/inbox/ 10,251 pageviews
- /apps/ 8,780 pageviews
- /support/ 8,456 pageviews
- /settings/users/ 7,687 pageviews
- /apps/authentication/ 7,581 pageviews
- /people/settings/ 7,425 pageviews
- /cms/ 7,347 pageviews
- /reports/ 6,127 pageviews
- /settings/ 5,078 pageviews
- /cms/training-videos/ 3,602 pageviews
- /support/settings/ 3,586 pageviews
- /marketing/ 3,142 pageviews
- /apps/accessibility/ 2,950 pageviews
- /apps/authentication/2fa/ 2,917 pageviews
- /apps/transfers/ 2,435 pageviews
- /apps/alerts/ 2,145 pageviews
- /settings/groups/ 1,999 pageviews
- /apps/deployment/ 1,867 pageviews
- /apps/cards/ 1,836 pageviews
- /monitor/ 1,830 pageviews
- /cms/form-builder/ 1,801 pageviews
- /apps/conversations/ 1,789 pageviews
- /apps/zelle/ 1,789 pageviews
Average Time on Page
Training videos are naturally the longest visited pages on the Knowledge Base. The top five longest visited pages include:
- Managing redirects 10 minutes 38 seconds | 64 pageviews
- Android store keys 9 minutes 09 seconds | 53 pageviews
- Creating an ad 8 minutes 01 seconds | 26 pageviews
- Publishing multiple pages 7 minutes 38 seconds | 12 pageviews
- Managing menus 7 minutes 17 seconds | 148 pageviews
The 10 most popular non-training video pages include the following:
12. Android Store Key (fastlane) 5 minutes 04 seconds | 1,016 pageviews
14. SymXchange implementation blueprint for customer use 4 minutes 58 seconds | 852 pageviews
15. Data aggregators 4 minutes 55 seconds | 235 pageviews
16. NuDetect 4 minutes 31 seconds | 908 pageviews
18. Electronic Statements - Interactive™ (ESI) 4 minutes 25 seconds | 923 pageviews
21. App Store Connect API keys 4 minutes 09 seconds | 887 pageviews
23. Direct Connect with Intuit and Quicken 4 minutes 07 seconds | 746 pageviews
24. Android Application Keys 4 minutes 06 seconds | 836 pageviews
25. Offline mode 3 minutes 59 seconds | 607 pageviews
26. External transfers 3 minutes 54 seconds | 1,556 pageviews
The list order above reflects the overall ranking for average time on page.
How many users have visited the site?
Since using Google Analytics starting in August 2020 through 2022, we’ve had 67,794 new users visit the Knowledge Base and 444,880 pageviews.